2.2.2 Campus food waste
SWU monitors the weight of food waste generated in its cafeteria areas. The food waste is reported to local fish pond operators, who collect it to be used entirely as fish feed. Additionally, SWU runs awareness campaigns to encourage the reduction of food waste in its cafeterias.
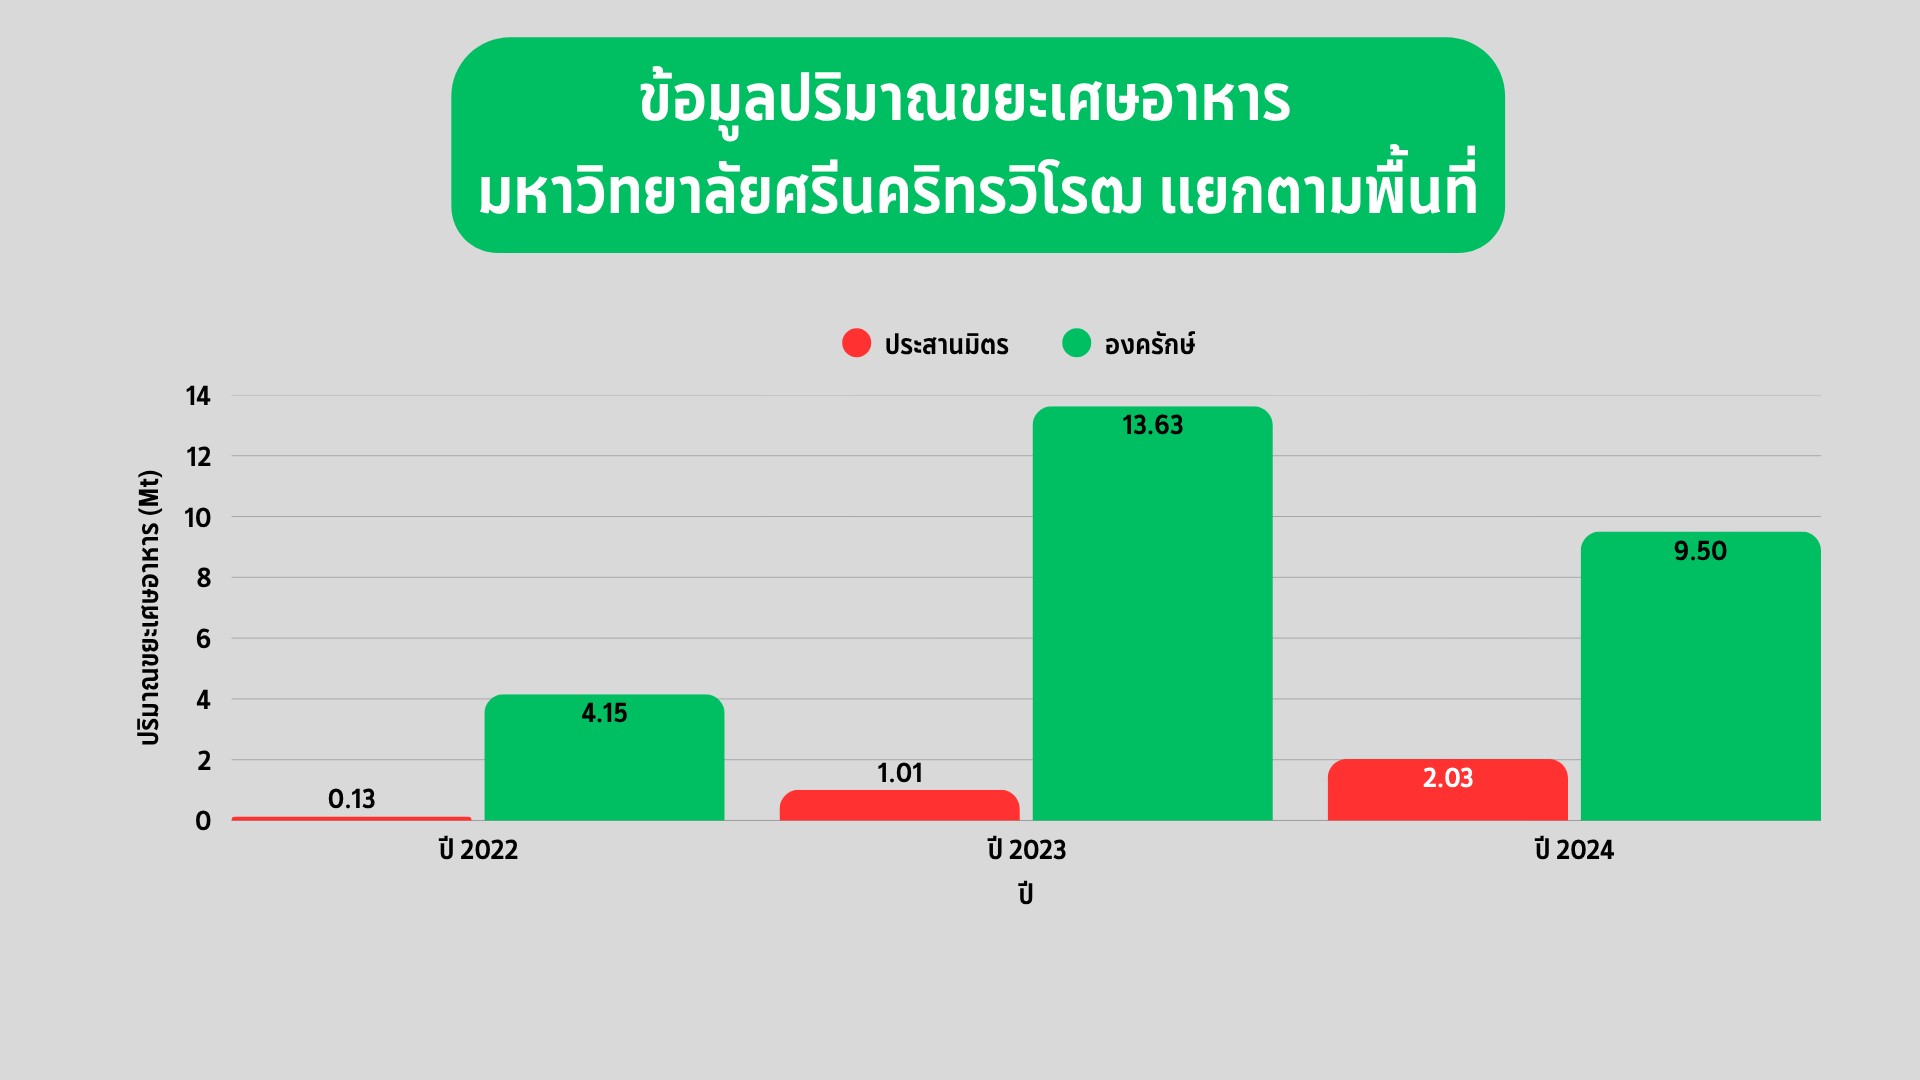
This bar chart presents the volume of food waste (in metric tons, Mt) generated at Srinakharinwirot University, disaggregated by campus location (Prasanmit and Ongkharak) for the years 2022, 2023, and 2024. The data illustrates the distinct contributions of each campus to the university's total food waste.
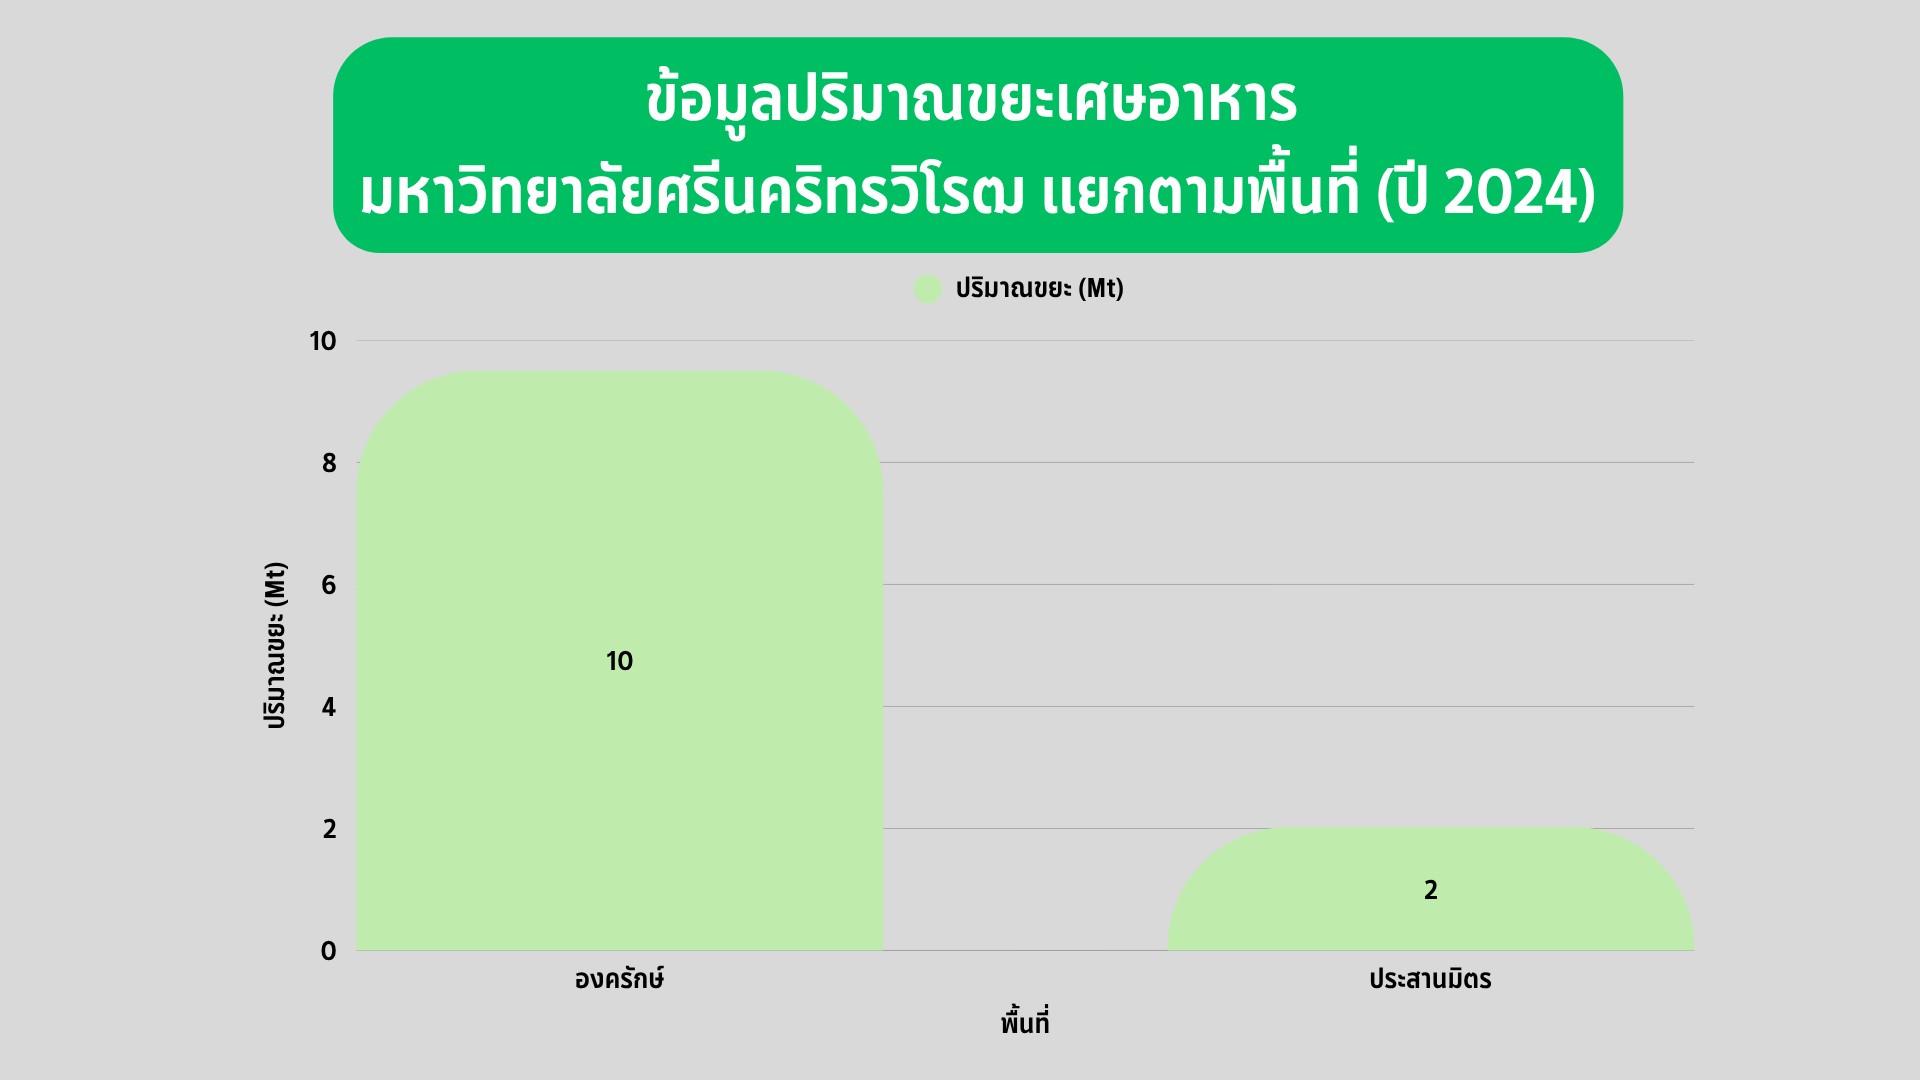
This bar chart illustrates the volume of food waste generated at Srinakharinwirot University in 2024, disaggregated by campus location: Ongkharak with 10 Mt and Prasanmit with 2 Mt. The data highlights the comparative food waste output of each campus for the specified year.
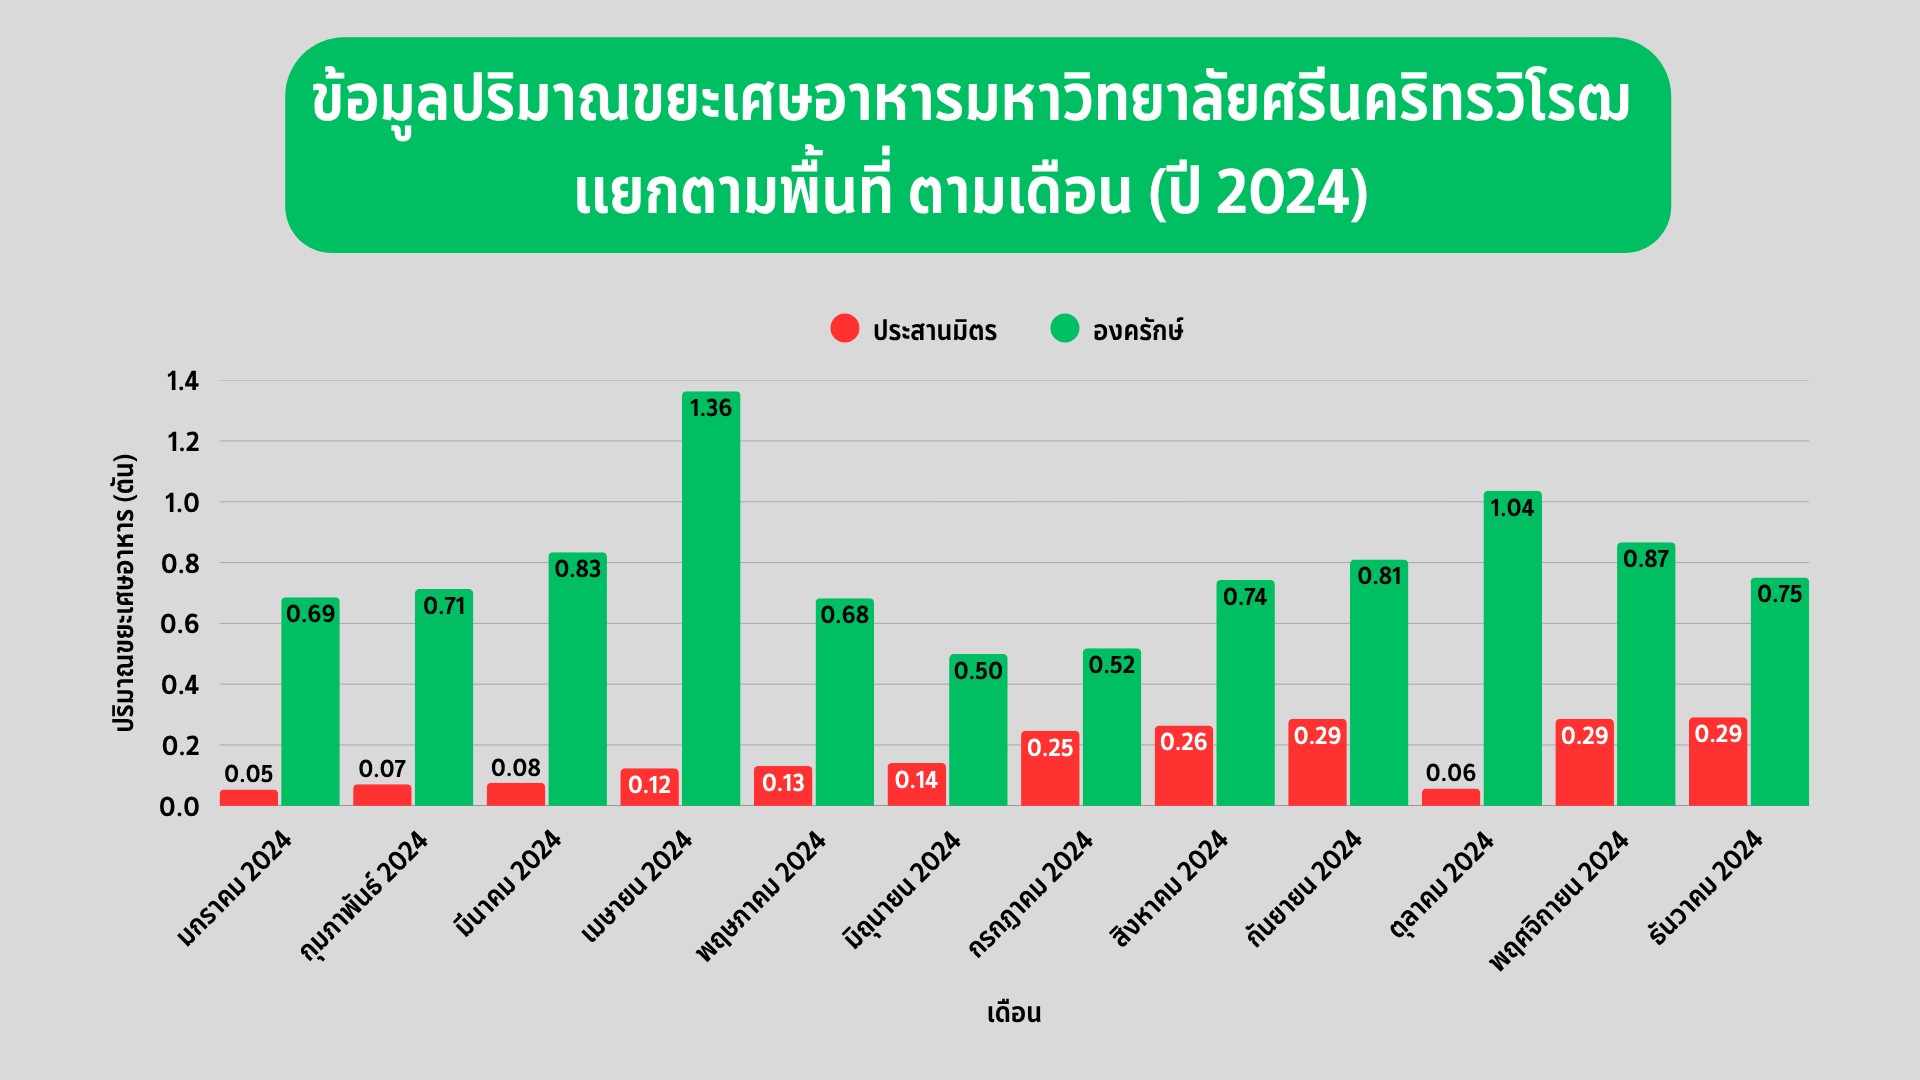
This bar chart provides a monthly breakdown of food waste volume (in metric tons) at Srinakharinwirot University's Prasanmit and Ongkharak campuses for the year 2024. For instance, in April, Ongkharak generated its highest waste at 1.36 Mt, while Prasanmit generally showed lower, yet consistent, waste volumes throughout the year, such as 0.29 Mt in September, November, and December.
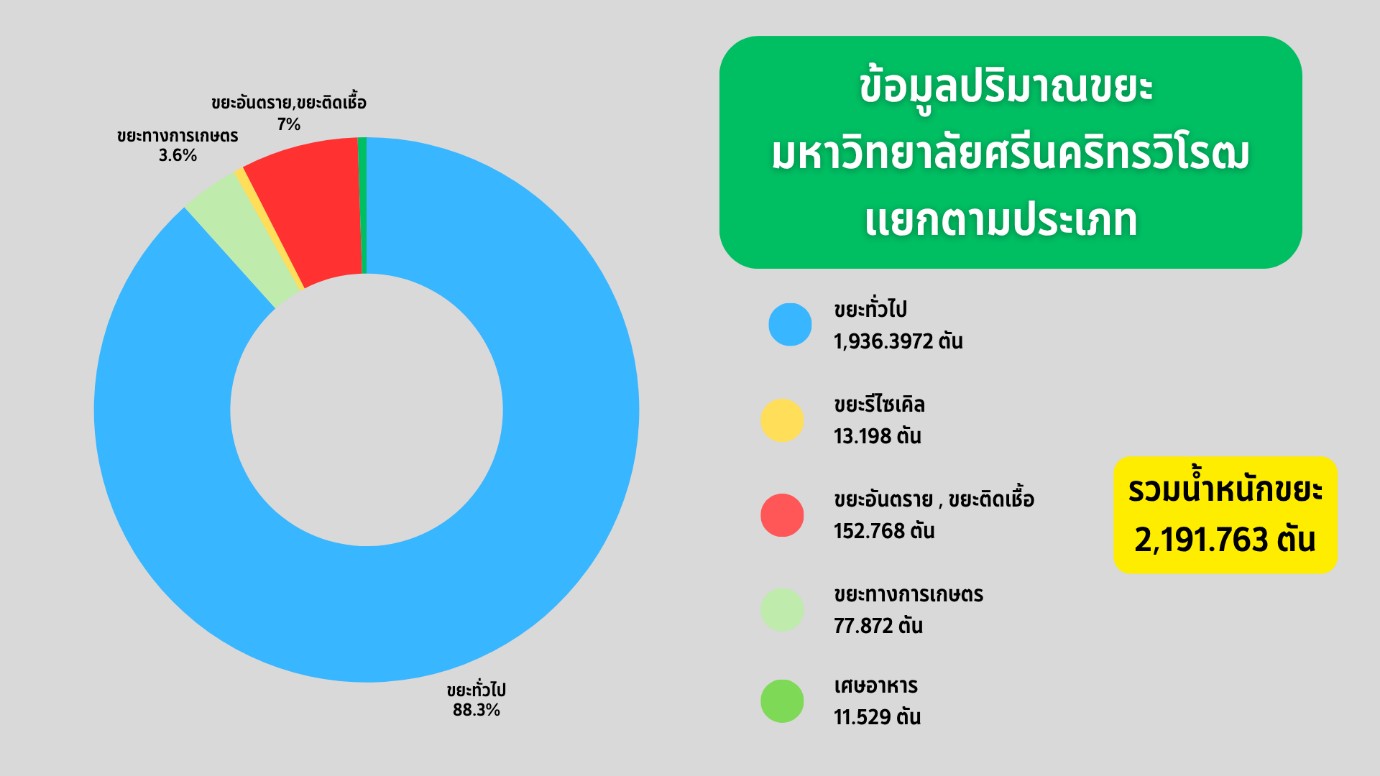
This donut chart details the waste volume at Srinakharinwirot University, categorized by type. General waste constitutes the largest portion at 88.3% (1,936.3972 tons), followed by hazardous and infectious waste at 7% (152.768 tons) and agricultural waste at 3.6% (77.872 tons). Recyclables account for 13.198 tons, and food waste for 11.529 tons, contributing to a total waste weight of 2,191.763 tons.
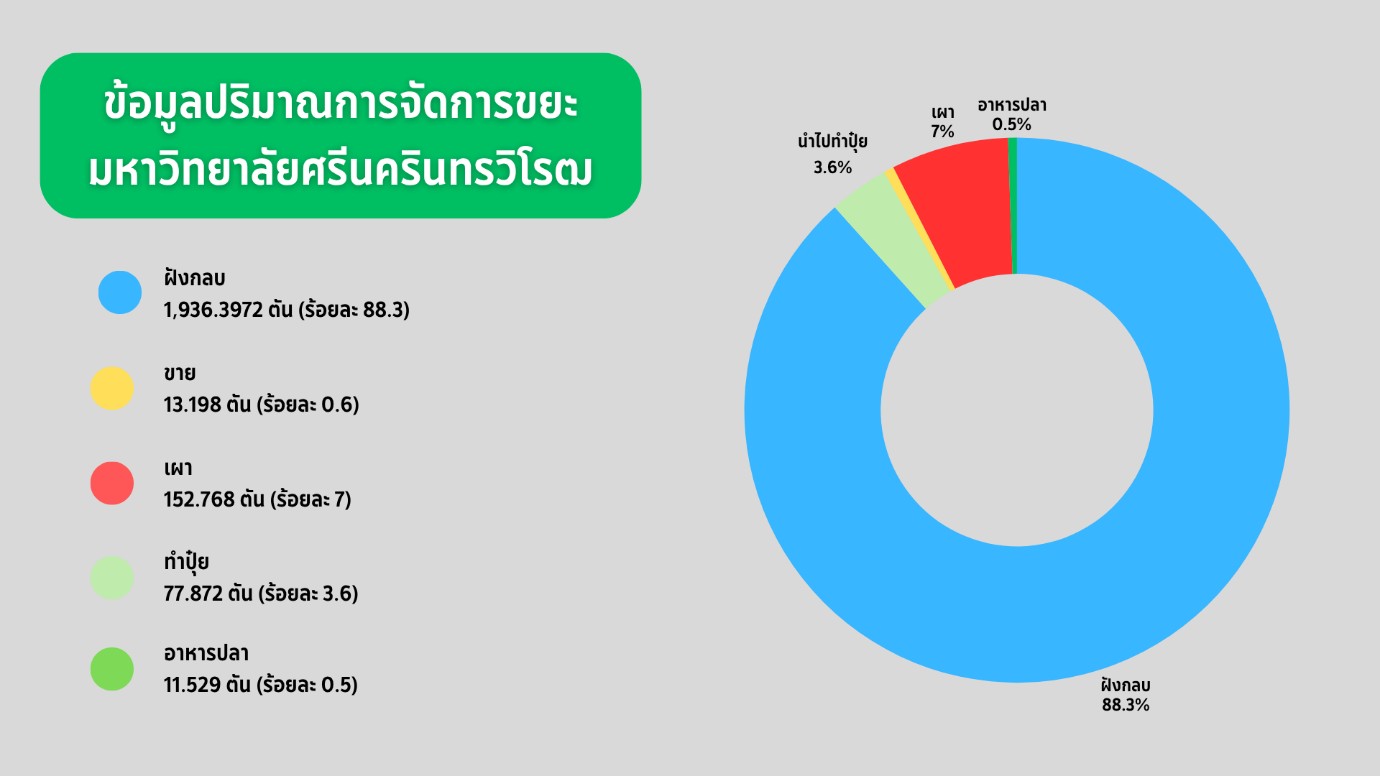
This donut chart visualizes the volume of waste management methods employed at Srinakharinwirot University. Landfilling accounts for the predominant portion at 88.3% (1,936.3972 tons). Incineration follows at 7% (152.768 tons), while composting represents 3.6% (77.872 tons). A smaller percentage is sold (0.6%, or 13.198 tons) and utilized as animal feed (0.5%, or 11.529 tons).
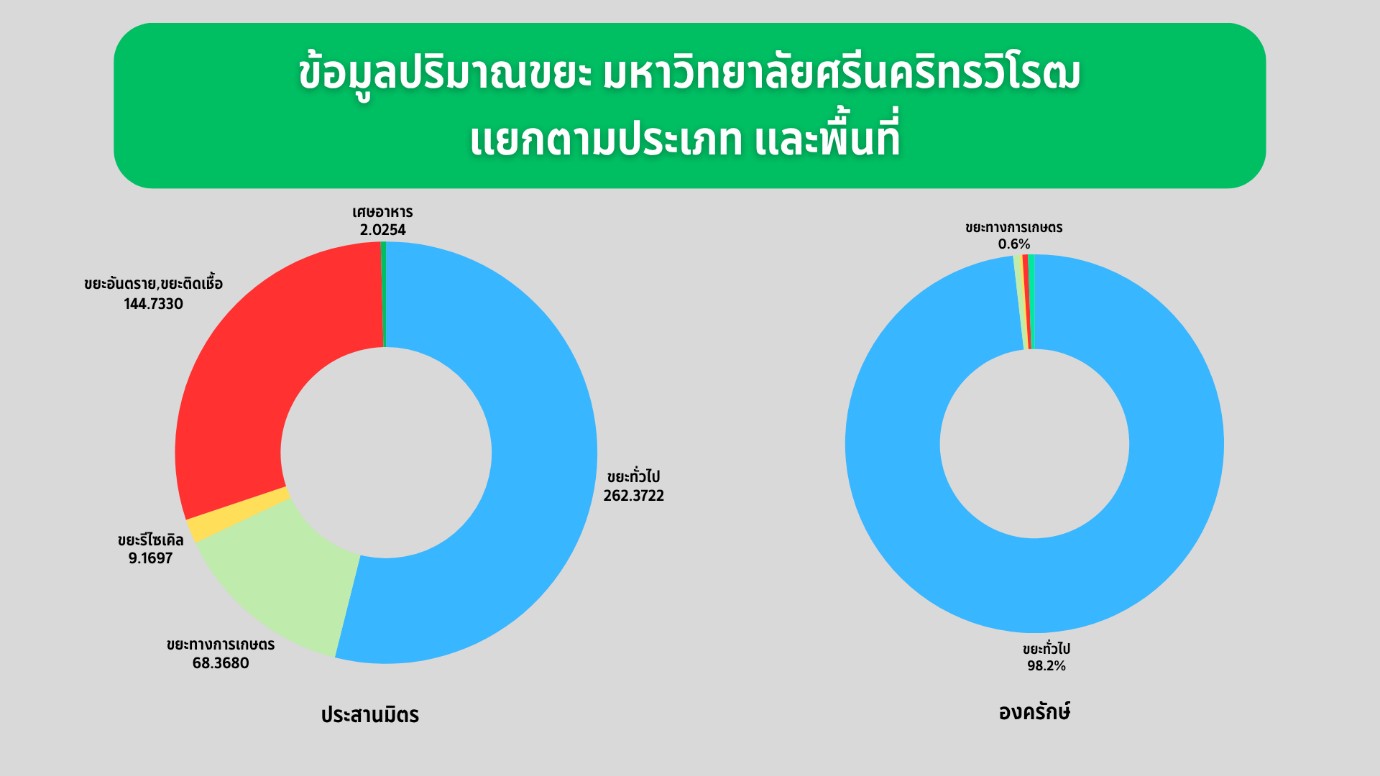
This twin donut chart illustrates the composition of waste volume at Srinakharinwirot University, categorized by waste type and campus (Prasanmit and Ongkharak). At Prasanmit Campus, general waste accounts for 262.3722 units, followed by hazardous/infectious waste at 144.7330 units, agricultural waste at 68.3680 units, recyclables at 9.1697 units, and food waste at 2.0254 units. In stark contrast, Ongkharak Campus predominantly generates general waste at 98.2%, with a small fraction (0.6%) being agricultural waste, indicating a significantly different waste profile between the two locations.